프로젝트/코드프레소 체험단
파이썬으로 구현하는 머신러닝 : 회귀분석 - 다중 선형회귀 분석 실습
KimCookieYa
2022. 1. 16. 19:52
다중 선형회귀 분석의 목표 : 종속변수를 가장 잘 설명할 수 있는 최적의 회귀변수를 찾아 회귀선을 추정하는 것
* LinearRegression API의 Method(함수)
- fit(X, y) : 학습 데이터를 이용하여 모델의 회귀계수(w) 와 편향(b)을 학습
- predict(X) : 모델에 테스트 데이터를 입력하여 계산된 예측값 반환
- score(X, y) : 모델에 테스트 데이터를 입력하여 모델의 성능지표(𝑅^2) 반환
* LinearRegression API의 Attribute(속성)
- coef_: 학습된 모델의 회귀 계수(W)
- intercept_: 학습된 모델의 bias 값(b)
13개의 독립변수(feature 속성)로 1개의 종속변수(lable) 예측하는 다중 선형회귀 분석 모델
-> 13개의 가중치를 가짐.
'''
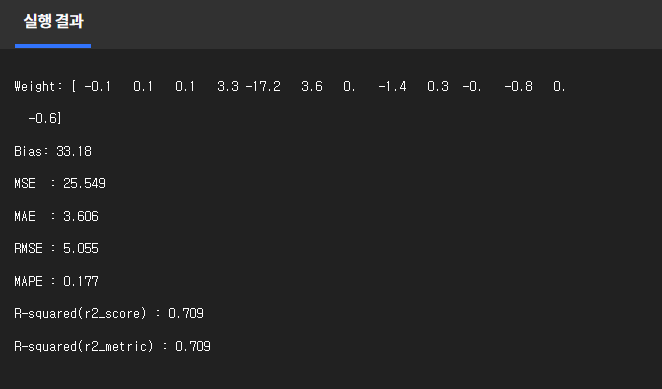
-------- [최종 출력 결과] --------
Weight: [ -0.1 0.1 0.1 3.3 -17.2 3.6 0. -1.4 0.3 -0. -0.8 0.
-0.6]
Bias: 33.18
MSE : 25.549
MAE : 3.606
RMSE : 5.055
MAPE : 0.177
R-squared(r2_score) : 0.709
R-squared(r2_metric) : 0.709
----------------------------------
'''
# 필요한 라이브러리 로딩
import numpy as np
import pandas as pd
from sklearn.datasets import load_boston
from sklearn.model_selection import train_test_split
from sklearn.linear_model import LinearRegression
# 모델 성능 평가를 위한 metrics 모듈 로딩
from sklearn import metrics
# 데이터셋 로딩
boston = load_boston()
# 데이터셋 분할
# random_state 값은 강의와 동일하게 지정하세요.
x_train, x_test, y_train, y_test = train_test_split(boston.data, boston.target, test_size=0.3, random_state=12)
# LinearRegression 객체 생성
regression = LinearRegression()
# 학습데이터 연결 및 학습 수행
regression.fit(x_train, y_train)
# 모델 예측
y_pred = regression.predict(x_test)
# 회귀 계수 출력
weight = np.round(regression.coef_, 1)
bias = np.round(regression.intercept_, 2)
print('Weight:', weight)
print('Bias:', bias)
# 컬럼별 회귀계수 출력
coef_table = pd.Series(data=weight,
index=boston.feature_names)
# 아래는 출력 결과만 확인하시고,
# 최종 제출시에는 주석으로 처리해주세요
# print('Regression Coefficients :')
# print(coef_table.sort_values(ascending=False))
# 회귀 분석 모델을 위한 평가 지표 계산
mse = metrics.mean_squared_error(y_test, y_pred)
mae = metrics.mean_absolute_error(y_test, y_pred)
rmse = np.sqrt(metrics.mean_squared_error(y_test, y_pred))
mape = metrics.mean_absolute_percentage_error(y_test, y_pred)
print('MSE : {0:.3f}'.format(mse))
print('MAE : {0:.3f}'.format(mae))
print('RMSE : {0:.3f}'.format(rmse))
print('MAPE : {0:.3f}'.format(mape))
# R-squared 를 통한 모델의 설명력 평가
r2_score = regression.score(x_test, y_test)
r2_metric = metrics.r2_score(y_test, y_pred)
print('\nR-squared(r2_score) : {0:.3f}'.format(r2_score))
print('R-squared(r2_metric) : {0:.3f}'.format(r2_metric))